Fairness, Metrics and Mitigation
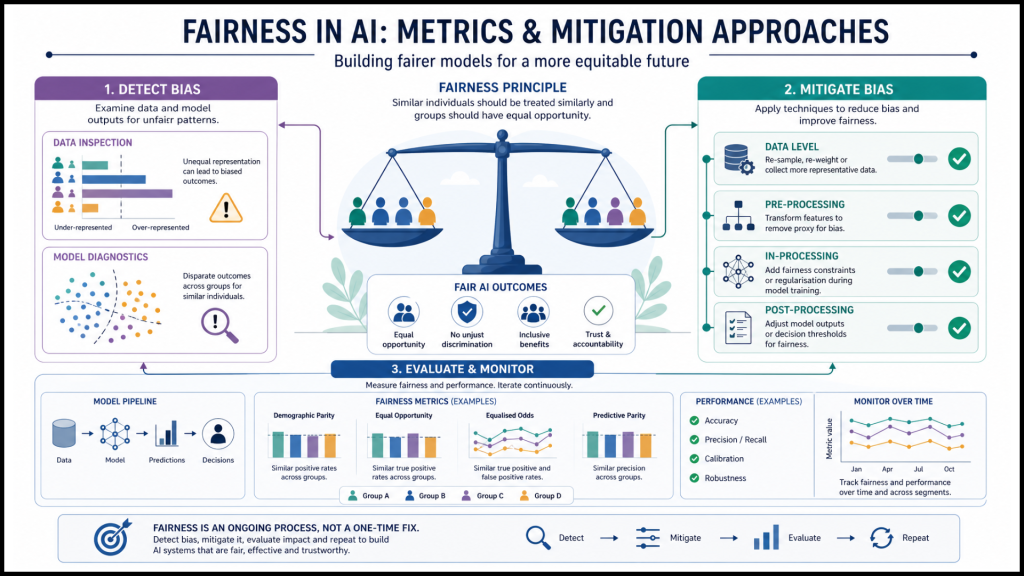
When someone says an AI system is fair, it is worth asking what they mean. Fairness is not a single number you can simply look up. There are several different ways to measure it, they do not always agree, and a system can look fair by one measure while being unfair by another. Measuring fairness is also only the first part of the task, because once a problem is found, something has to be done about it, and every option carries its own cost.
You will rarely be the person who calculates these measures or rebuilds a system. But you will work directly with these systems, so you need to read a fairness claim carefully and critically, understand what a proposed fix will and will not do, and know when a question is outside your authority.
In this section you will learn:
- what the main fairness metrics measure, and why each one captures only part of what fairness means
- why certain fairness measures can conflict, so a system cannot always satisfy them all at once
- the difference between a system being accurate and a system being fair
- the main ways to reduce bias and error, and the trade-offs each one carries
- when a fairness question is beyond your role and needs to be escalated
Measuring fairness: the first two metrics
Here, bias means a systematic tendency in a system that produces unfair outcomes for a group of people. A fairness metric is a defined way of checking, in numbers, whether a system is treating groups equally. There is more than one metric because there is more than one thing people mean by fair, and each metric captures one of those meanings. No single metric proves that a system is fair overall. Each one answers a narrower question, and you have to know which question it answers.
Demographic Parity
Demographic parity
Demographic parity asks whether the system says yes at the same rate to each group. If a hiring tool shortlists twenty in every hundred applicants from one group, demographic parity is met when it shortlists about twenty in every hundred from every other group too.
This matters because a large gap in the yes rate between groups is often the first sign worth investigating. What you do differently is understand that this metric looks only at the rate of positive outcomes, and not at whether those outcomes were accurate. A system could reach equal rates by approving one group too easily and rejecting another too readily, so demographic parity on its own does not tell you the decisions were sound.
Equalised Odds
Equalised odds
Equalised odds looks at the system’s accuracy separately for the people who should get a yes and the people who should get a no. Among the people who genuinely should be approved, it asks whether the system approves them at the same rate for each group. Among the people who genuinely should be rejected, it asks whether the system wrongly approves them at the same rate for each group. A system meets equalised odds only when both of those rates match across the groups.
This matters because a system can meet demographic parity, by approving each group at the same overall rate, while still getting one group’s genuine cases wrong far more often than another’s. What you do differently is recognise that this metric compares the system’s mistakes among the people who should pass separately from the people who should not, rather than looking only at the overall rate of yes and no.
See it in action
A team checks a shortlisting tool and finds it shortlists each group at the same rate, so it meets demographic parity. That looks reassuring. When they look further, they find that among the applicants who were genuinely well matched to the role, the tool passed one group far less often than the other, and made the overall numbers equal by passing weaker applicants from that group instead. The overall rate was equal, but the mistakes were not. Demographic parity showed nothing wrong. Looking at the system’s errors, in the way equalised odds does, showed that one group’s strong applicants were being failed.
Measuring fairness: two more metrics
The next two metrics look at fairness in different ways again, which is part of why fairness is hard to capture in a single number.
Calibration
Calibration
Calibration asks whether a score from the system means the same thing for each group. If a tool says an applicant has an eighty per cent chance of succeeding, calibration is met when eighty per cent of the people given that score actually do succeed, whatever group they are in. The score is trustworthy in the same way for everyone.
This matters because scores are often treated as if they carry the same meaning for all, when they may not. What you do differently is understand that a well-calibrated system can still fail the other metrics, because a score that is equally trustworthy across groups can still be given to people at very different rates.
Individual Fairness
Individual fairness
Individual fairness asks whether two people who are alike in the ways that matter for the decision are treated alike. Rather than comparing whole groups, it looks at whether similar individuals get similar outcomes.
This matters because group-level fairness can still allow two near-identical people to be treated very differently. What you do differently is recognise that this idea depends entirely on deciding who counts as similar, and that the choice of what counts as a relevant similarity is itself a judgement that can carry questionable assumptions. Deciding that two applicants are alike apart from their background is only fair if background truly is irrelevant to the decision, which is not always obvious.
See it in action
A tool gives applicants a score, and a team confirms it is well calibrated, so a score of seventy means about a seventy per cent chance of success for every group. They are tempted to treat that as proof the tool is fair. When they look at who receives the high scores, though, one group receives them far less often, because of a real difference in the data behind the scores. The scores mean the same thing for everyone, which is what calibration guarantees, and yet the two groups still end up with very different outcomes. Calibration told them the scores were trustworthy in the same way for each group. It did not tell them the outcomes were equal.
What fairness metrics can and cannot tell you
A fairness metric is a useful tool, but it is easy to ask more of it than it can give. Knowing the limits keeps you from trusting a number that does not mean what it appears to.
The limits of the metrics
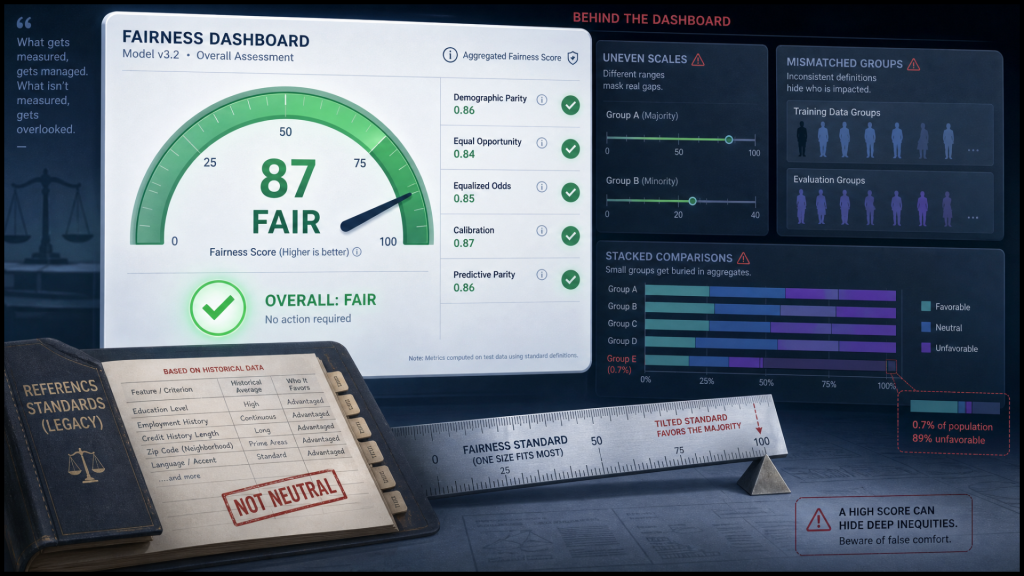
A metric measures one defined aspect of fairness, so a good result on one metric is not proof that a system is fair in every sense. The result also depends on how you set it up, because it changes with how the groups are defined, how the outcome is defined, and what counts as success. Some metrics need a reliable record of the correct answer to compare against, and if those records are themselves biased, the metric will report a system as fair when it is not, because the standard it is judged against is itself biased.
An overall result can also hide harm to a small group. A system can look fair when you compare two large groups, yet be treating a smaller group, or people who belong to more than one group at once, much worse. The average across everyone conceals the people in the smallest groups.
This matters because a single reassuring number can create false confidence. What you do differently is ask what a fairness figure was actually measuring, how the groups were defined, and whether smaller or overlapping groups were looked at, rather than accepting a single overall result as a complete assessment.
Metrics beyond scoring systems
The four metrics described here fit systems that score or classify people or cases. They do not apply to every AI system. For a generative system that produces text or images, there may be no single score to compare, so fairness is often checked differently, by looking at whether the system produces more inaccurate, harmful, stereotyped or inappropriate outputs for some groups or some prompts than others.
This matters because applying a scoring metric to a system it does not fit will give a meaningless result. What you do differently is recognise that the right way to check fairness depends on the kind of system in front of you.
Fairness is not the same as accuracy
A system can be accurate overall and still be unfair. It can be highly accurate on average while performing poorly for one group whose cases it rarely saw. It can approve two groups at similar rates while making far more wrong rejections in one of them. And its fairness figure can be made to look better while it still causes real harm to real people.
This matters because accuracy is often reported as if it settles the question of fairness, and it does not. What you do differently is treat accuracy and fairness as two separate questions, and ask about both.
See it in action
A team tests a tool by comparing men and women, and separately by comparing two age bands, and on each comparison the tool looks fair. Someone then looks at a smaller group defined by both at once, older women, who were part of every comparison but were never looked at on their own. For that group the tool performs far worse. Each broad comparison had averaged them in with everyone else and hidden the harm. It only appeared once the smaller, overlapping group was looked at directly.
Why fairness metrics conflict
One of the hardest things to accept about fairness is that some of these measures cannot all be met at the same time. Improving one can worsen another, and in many real situations you cannot satisfy every measure at once.
The conditions that cause the conflict
The conflict is not a mystery and it is not universal. It becomes likely under particular conditions. It arises when the groups being compared have different underlying rates of the outcome the system is predicting. It arises when the system is not perfectly accurate, as is usually the case in real-world predictive systems. And it arises because some measures focus on equal rates of yes and no, while others focus on equal rates of error, or on scores that mean the same thing. When these conditions occur together, certain combinations of fairness measures cannot all be met at once. This does not mean every measure conflicts with every other, or that meeting one always breaks another. It means that particular combinations become impossible to satisfy together once the groups have different base rates and the system is imperfect.
This matters because it means “make the system fair” is not a single instruction that can always be satisfied. What you do differently is understand that a choice between fairness measures may have to be made, and that it is a real decision with consequences, not a technical detail.
A caution about the base rates
It is tempting to treat a difference in outcome rates between groups as a simple fact of the world that the system is merely reflecting. Be careful with that. A measured difference between groups may itself be the result of historical discrimination, unequal access or opportunity, biased labels, or inequality built into the wider system that produced the data. Treating such a rate as natural or fair can reproduce past unfairness in a new system without anyone noticing.
This matters because the reason for a difference changes what the right response is. What you do differently is treat a gap between groups as something to question, not as a neutral fact you are obliged to preserve.
See it in action
A team reviews a tool that gives each loan applicant a risk score. The tool’s scores are calibrated within each group, so a given score means the same real chance of repaying whichever group an applicant is in. The two groups have different underlying repayment rates in the historical data, and the tool is not perfectly accurate, as is usual for real predictors. The team also wants the tool to make its mistakes evenly, so that wrong rejections and wrong approvals happen at the same rate for each group, which is equalised odds. They find they cannot have all of this at once. Keeping the scores calibrated within each group, while the base rates differ and the tool is imperfect, forces the wrong-rejection and wrong-approval rates to come out unequal between the groups. Because there is no organisational rule on which measure should take priority, the team does not choose between them on their own. They set out the conflict plainly and raise it for a decision. They also ask why the underlying repayment rates differ in the first place, and recognise that the past data reflects who was able to borrow before, not who can repay now.
Reducing bias and error
When a problem is found, there are several kinds of response. They work at different points, at the data, model, output and process levels, and matching the response to where the problem came from is what makes it effective.
Working at the level of the data
Data-level approaches fix the problem in the material the system learns from or runs on.
This can mean:
- correcting inaccurate labels
- improving how well a group is represented
- collecting missing data
- rebalancing the examples so one group does not dominate
This matters because a problem that starts in the data is best fixed there, before it is built in. What you do differently is recognise that where poor or unrepresentative data is the cause, changing the model afterwards deals with the effect while leaving the cause in place.
Working at the level of the model
Model-level approaches change how the system is built.
This can mean:
- changing what the system is optimised to achieve
- adding a fairness rule the system has to respect
- changing how it weighs one kind of mistake against another
This matters because some problems come from how the system was tuned rather than from the data. What you do differently is understand that these changes usually need the people who built the system, and are not something you can do by changing a configuration setting.
Working at the level of the output
Output-level approaches leave the system as it is and adjust what happens to its results.
This can mean:
- changing the threshold that decides a yes or a no
- flagging low-confidence cases for a closer look
- routing certain outputs to a person before they are acted on
This matters because it can be the fastest response, and sometimes the only one available for a system whose data or model you cannot change. What you do differently is recognise it as a real option while remembering that it deals with the result rather than fixing the cause.
Working at the level of the process
Process-level approaches change how the system is used and governed, rather than the system itself. This is often the most important category when you are working with a bought-in or third-party tool whose data and model you cannot change.
It includes:
- narrowing what the tool is used for
- restricting when or for whom it is used
- giving people a way to challenge or correct a decision that affects them
- asking the supplier for evidence about the data the tool was trained on, any bias they have found, and any fairness testing they have done
- adding human review that is a genuine check rather than a formality
- deciding not to use the tool, or withdrawing it, when the risk cannot be brought down far enough
This matters because in this kind of role you will often be unable to change a system’s data or model, and these are the options you do have. What you do differently is treat how a tool is used and overseen as a genuine way to reduce harm, not merely a final option.
The trade-offs every fix carries
Every mitigation has costs. Reducing harm to one group can increase it for another, or trade one kind of error for another. A fix can lower the system’s usefulness or accuracy in some situations. Collecting more data about people, in order to check fairness, can create privacy, data-protection or legal risk. Removing a sensitive characteristic can fail because another piece of information still stands in for it, such as a postcode that closely tracks ethnicity. Adding human review can reintroduce the very human bias the system was meant to avoid. And any fix applied at the output or process level can deal with the effect while leaving the original organisational or structural cause untouched.
This matters because a fix presented as a clear improvement may simply be reducing harm to one group by increasing it for another, or reducing one kind of error by increasing another. What you do differently is ask what a proposed mitigation costs and who it affects, not only what it improves.
See it in action
A team finds that a tool wrongly rejects far more people from one group than another. They cannot change the model, but they identify that applying a different threshold to the affected group could reduce the difference in wrong-rejection rates. It would also increase wrong approvals, and it would mean applying different decision rules to different groups. Because that creates legal, ethical and governance questions, the team does not make the change itself. It records the expected benefit, the additional errors it could create, and the people it would affect, then escalates the proposal for an authorised decision.
Your role and when to escalate
Reading fairness and naming a sensible response is within your role. Deciding an organisation’s fairness position, and approving high-stakes systems, is not. Knowing which decisions are within your authority is part of doing the job well.
When to stop and escalate
Some situations should be taken to someone with more authority, more specialist knowledge, or both, rather than settled on your own. Stop and pass a fairness question to someone else when:
- the system affects high-impact decisions about people, such as employment, finance, health, education, or access to services
- the work involves protected-characteristic data, special category personal data, or other data that could create significant privacy or equality risks
- fairness metrics conflict and there is no clear organisational position on which one should take priority
- there is not enough data to check smaller groups reliably, so you cannot tell whether they are being harmed
- a supplier is unable or unwilling to provide meaningful evidence about their system
- a proposed mitigation would apply different rules or thresholds to different groups, would push more wrong approvals or wrong rejections onto one group, or would create legal or ethical uncertainty
- you are unsure whether something meets legal requirements, including whether treating groups differently is even allowed
This matters because acting alone on any of these can commit the organisation to a position it has not properly decided, or break a legal duty without anyone realising. What you do differently is treat these as reasons to stop and escalate, with what you have found set out clearly, rather than continuing on your own.
See it in action
A team is asked to introduce a bought-in tool that scores customers for a service. They cannot see or change its data or model, so the only responses open to them are at the process level. They try to check whether smaller groups are being treated worse, but there are too few cases in some groups to tell. The tool affects access to a service, it uses personal data about protected characteristics, and it cannot be checked reliably for those smaller groups. Because all three escalation conditions apply, the team does not decide on their own whether the tool is fair enough to use, and they do not start using it while the question is open. They write down clearly what they could and could not check, and pass the decision to someone with the authority to make it. If that person later approves a limited trial, any human review built into it would need people with the right knowledge and authority, working to a clear procedure, who are able to overturn the tool’s result rather than simply approve it.
Summary
Fairness is not one thing, and no single number captures it. Demographic parity looks at equal rates of yes. Equalised odds looks at whether the system’s mistakes are equal for each group, checking the people who should pass separately from those who should not. Calibration looks at scores that mean the same for each group. Individual fairness looks at whether similar people are treated alike. Each measures only part of fairness, each has limits, and they fit scoring systems better than they fit generative ones. A system can be accurate overall and still be unfair, so accuracy and fairness are separate questions.
Some of these measures cannot all be met at once, especially when groups have different underlying rates and the system is imperfect, and those underlying rates may themselves reflect past unfairness rather than neutral fact. When a problem is found, it can be tackled in the data, in the model, at the output, or through how the system is used and governed, and process-level responses matter most when you cannot change a bought-in tool. Every fix carries a trade-off. Reading all of this and naming a sensible response is yours to do. Deciding the organisation’s position on high-stakes, sensitive or legally uncertain cases is not, and knowing when to stop and escalate is as much a part of the work as the analysis itself.